The Salad Bowl Project
  • Home
  • About
    • About The Project
    • The Research
    • FAQ
  • Migration 101
    • Migration at a Glance
  • Migration Myths
    • Immigrants Are Criminals
    • Immigrants Steal Our Jobs
    • Immigrants Are Un-American
    • Immigrants Don't Pay Taxes
    • Immigrants Abuse the Welfare System
  • Migration Stories
Picture
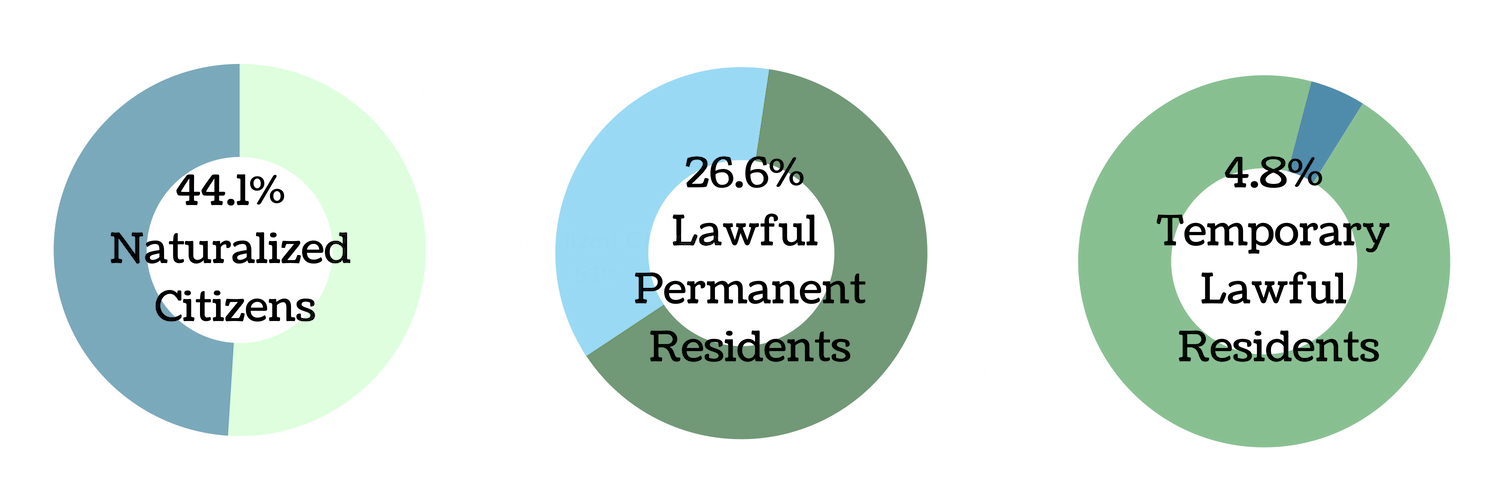
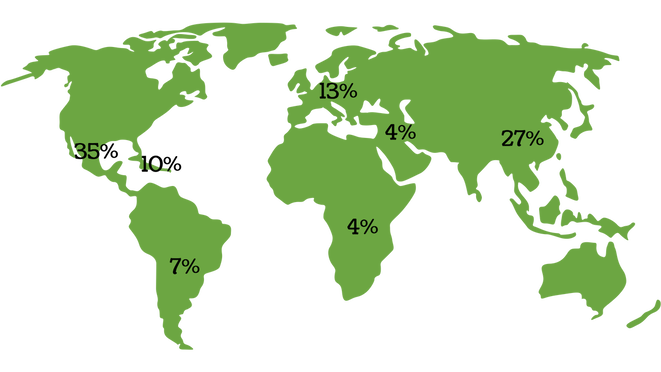
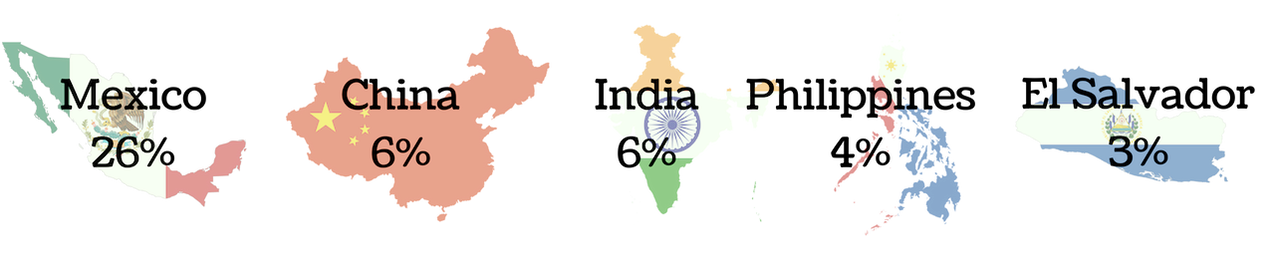
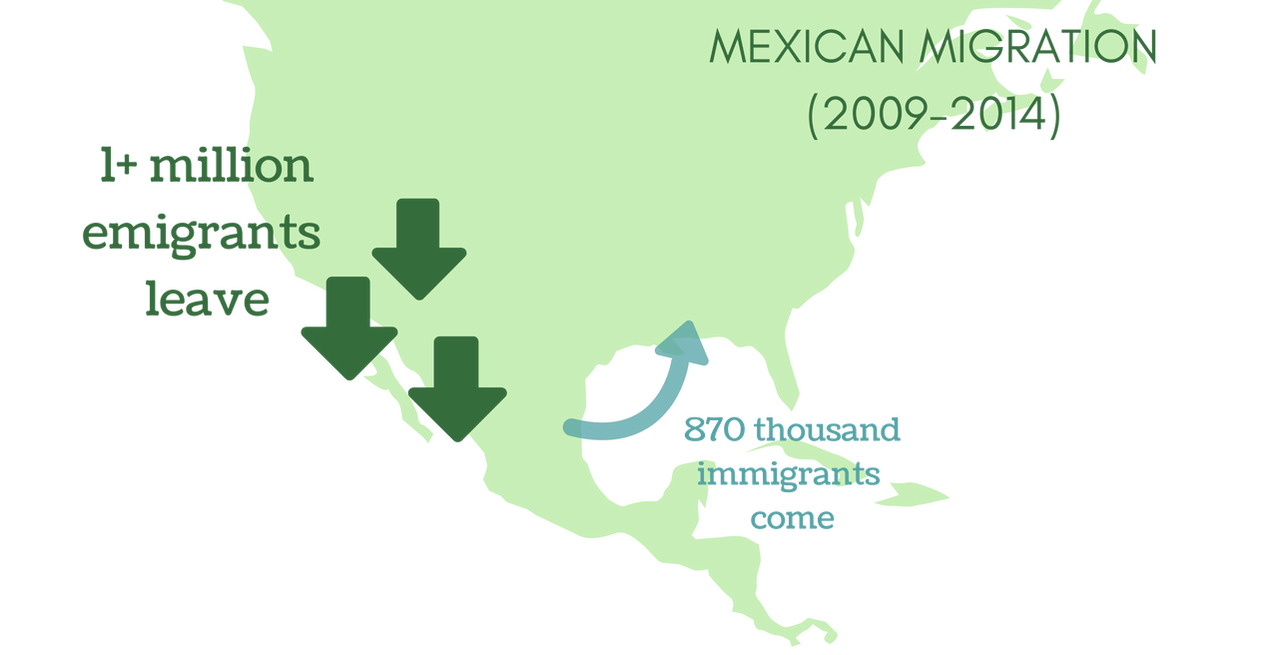
A quick run-down of basic U.S. migration statistics

OVERVIEW


Trying to separate the way that we feel about immigration and the facts about immigration can be difficult.

That’s why we’ve scoured all the migration statistics we could find and put them all together in one place. Reading this will give you some context on the immigration debate and should help you better understand what we’re really working with when we talk about immigration in the United States.
Picture

How many Immigrants Live in the U.S. Today?[1] 
As of 2016 there were more than 43 million immigrants living in the United States. That’s over 13% of the total population.
 
Want the exact breakdown?
In 2016 there were a total of 323,127,515 people living in the U.S.
86.5% of them, or 279,445,861, were born in the U.S.
13.5% of them, or 43,681,654, were born outside of the U.S.

​
Of those immigrants…
48.7%, or 21,266,342, were U.S. citizens. 
51.3%, or 22,425,312, were not U.S. citizens.

Picture


But that doesn’t mean that more than half of the immigrant population are undocumented.
 
Migrants by Legal Status[2] 
The most recent data we have on undocumented immigrants is from 2015. But its still comparable to the most recent 2016 data that we have on immigrants as a whole.
​
Picture

In 2015, there were 44.7 million immigrants living in the United States. Of the total immigrant population only 11 million or 24.5% were living in the U.S. illegally. In contrast, 75.5%  33.8 million of immigrants were living in the U.S. legally.

​Of those lawful immigrants…

19.8 million or 44.1% were naturalized citizens
11.9 million or 26.6% were lawful permanent residents
2.1 million or 4.8% were temporary lawful residents
Picture
​ 


Picture
Population Peak
Overall, the current migrant population, undocumented or not, is actually pretty low.

Even though there are more than 43 million immigrants living in the U.S. today, the immigrant population actually peaked more than 100 years ago at 9.2 million. In 1980, that was 14.8% of the population of the United States—the highest its ever been.
[3]  

 ​​
​Population Growth
The population of a country goes up when babies are born (of course!) but it also increases when a country receives new immigrants. In the United States, immigration is an important source of population growth.

​Between 1965 and 2015, about 55% of the total U.S. population growth was because of immigrants. New immigrants and their children and grandchildren accounted for 72 million of the total 131 million person increase from 1965 and 2015.[4]

Picture

Overall, there are more than 1 million people who immigrate into the U.S. each year.[5] That sounds like a lot. But don’t forget! Just like people immigrate into the U.S. they emigrate from the U.S. too. Migration is constantly changing with people coming and going all the time.


WHO'S IMMIGRATING, ANYWAY?

Picture
Migrants by Region 
Immigrants come to the United States from all over the world but certain regions send more migrants than others. Today in the United States, the most popular immigrant region of origin is Central America and Mexico followed closely by Asia.[6]  
 
Central America/Mexico (35%)
South and East Asia (27%)
Europe/Canada (13%)
The Caribbean (10%)
South America (7%)
The Middle East (4%)
Sub-Saharan Africa (4%)
 

​Migrants by Country
Top Origin Countries of Migrants Living in the U.S.
You’re probably not surprised to find out that Mexico is the top country of origin of immigrants living in the U.S. In 2016 there were 11.6 million Mexicans living in the United States. That’s 26% of the total immigrant population. After Mexico, comes China and India, both at 6%, the Philippines at 4%, and El Salvador at 3%.[7]

Picture
Origin Countries Migrating Today
Even though two Latin American countries are in the top five immigrant countries of origin, Latin American migration, especially Mexican migration, has been on the decline since the 2008 recession. Currently, there is actually negative net migration from Mexico. That means that there are more Mexican migrants leaving the United States than there are Mexicans coming into it.

From 2005-2010 there was a net -20,000 Mexican migrants leaving the United States.
​From 2009-2014 there was a net -140,000 Mexican migrants leaving the United States.[8]
Picture
​
​Instead, more immigrants are coming from Asia. In 2016 the top countries of origin of new migrants (as opposed to those migrants already living in the United States) were India (126,000), Mexico (124,000), China (121,000), and Cuba (41,000).
[9]
Picture

​Migrants by Race/Ethnicity
In fact, by 2055 Asians are projected to surpass Hispanics as the largest immigrant group in the U.S. Pew Research Center estimates that, in 2065, 38% of all immigrants living in the United States will be Asian. By then, they expect Hispanics to make up 31% of the immigrant population with white immigrants at 20% and black immigrants at 9%.[10]
 
​

WHERE ARE THEY GOING?

Picture
Picture
​
​Migrants by States of Residence

Top Ten States with the Most Immigrants[11]
Most of the top ten U.S. states with the most immigrants probably won’t surprise you. They include states that are associated with high immigrant populations--like 
California, Texas, New York and Florida—and states with large metropolises like Illinois (Chicago), Washington (Seattle), and Georgia (Atlanta).
 
1. California 10,680,264 (27.2% of total state population)
2. Texas 4,707,859 (16.9% of total state 
population)
3. New York 4542675 (23% of total state 
population)
4. Florida 4237561 (20.6% of total state 
population)
5. New Jersey 2006279 (22.4% of total state 
population)
6. Illinois 1772722 (13.8% of total state 
population)
7. Massachusetts 1126192 (16.5% of total state 
population)
8. Georgia 1034063 (10% of total state 
population)
9. Virginia 1022197 (12.2% of total state 
population)
10. Washington state 1019317 (14% of total state 
population
) 
Picture
​Top Ten States with the Most Immigrants (by Percentage) [12]
But when you look at the proportion of immigrants to U.S. born citizens, the top ten states change adding Nevada, Hawaii, Maryland, and Connecticut to the mix.
 

1. California 27.2%
2. New York 23%
3. New jersey 22.4%
4. Florida 20.6%
5. Nevada 19.9%
6. Hawaii 18.3%
7. Texas 16.9%
8. Massachusetts 16.5%
9. Maryland 15.2%
10. Connecticut 14.6%

 
The following states (plus the top ten listed above) have an immigrant population above 10% of their total population:
Rhode island 14.1%, Washington state 14%, Illinois 13.8%, Arizona 13.6%, D.C. 13.3%, Virginia 12.2%, and Georgia 10%.

Sources:

Sources Referenced: 
[1] All data from here  http://www.pewresearch.org/fact-tank/2018/09/14/key-findings-about-u-s-immigrants/. See the section called “Population, region of birth, nativity and years in the U.S.” 

[2] All data is from http://www.pewresearch.org/fact-tank/2018/09/14/key-findings-about-u-s-immigrants/ph_16-06-02_foreign-bornbreakdown-2/

[3] http://www.pewresearch.org/fact-tank/2018/09/14/key-findings-about-u-s-immigrants/; See “How many people in the U.S. are immigrants?”

[4] http://www.pewhispanic.org/2015/09/28/modern-immigration-wave-brings-59-million-to-u-s-driving-population-growth-and-change-through-2065/; See the third paragraph of “Post-1965 Immigration Drives U.S. Population Growth Through 2065”

[5] http://www.pewresearch.org/fact-tank/2018/09/14/key-findings-about-u-s-immigrants/; See "Who is arriving today?"

[6] http://www.pewresearch.org/fact-tank/2018/09/14/key-findings-about-u-s-immigrants/; See "Where do immigrants come from?" 

[7] http://www.pewresearch.org/fact-tank/2018/09/14/key-findings-about-u-s-immigrants/; See "Where do immigrants come from?"

[8] http://www.pewhispanic.org/2015/11/19/more-mexicans-leaving-than-coming-to-the-u-s/; This is difficult to measure, see text box for data limitations. 

[9] http://www.pewresearch.org/fact-tank/2018/09/14/key-findings-about-u-s-immigrants/; See “Who is arriving today?”

[10] http://www.pewresearch.org/fact-tank/2018/09/14/key-findings-about-u-s-immigrants/; See “Who is arriving today?” Also http://www.pewhispanic.org/2015/09/28/modern-immigration-wave-brings-59-million-to-u-s-driving-population-growth-and-change-through-2065/

[11] All of the information from this section is from http://www.pewhispanic.org/2018/09/14/facts-on-u-s-immigrants-current-data/; See “Region and top five states of residence” and the graphic called “Nativity, by state: 2016"

[12] Top Ten Destination top ten highest pops by percentage (my own analysis); Data from http://www.pewhispanic.org/2018/09/14/facts-on-u-s-immigrants-current-data/; See the "Region and Top Five States of Residence" section, graphic called “Nativity, by state: 2016"

​

Home

Sources

Contact

​

Salad Bowl Project Copyright © 2018
  • Home
  • About
    • About The Project
    • The Research
    • FAQ
  • Migration 101
    • Migration at a Glance
  • Migration Myths
    • Immigrants Are Criminals
    • Immigrants Steal Our Jobs
    • Immigrants Are Un-American
    • Immigrants Don't Pay Taxes
    • Immigrants Abuse the Welfare System
  • Migration Stories